6 reasons why you should not use external Power BI visuals
Hey everyone! Happy 2023!
Here’s my daughter from our trip to British Columbia last summer, looking not-to-pleased in a double-kayak:
You’d think she’d be pleased, right? We were out on the water in Deep Cove, B.C., on an absolutely beautiful day.. and she LOVES kayaking.
Usually.
This time however, the kayak rental place had a rule that anyone under 16 couldn’t pilot a solo kayak. She’d have to share a kayak with an adult. Nevermind that we spent hours and hours every week out on the wilds of Lake Ontario that summer… rules are rules. She’d have to be in a double-kayak.
She was NOT happy about this turn of events. She’s 12. She needs her own her boat, that she can control… not trapped on a double kayak with her father. OH. MY. GOD.
This control issue is what brings me to the topic of this post… using External Visuals in your Power BI reports.
There’s a plethora of free and paid visuals in the Microsoft AppSource resource. It’s a whole ecosystem of visuals. There are developers all over the place building visuals for Power BI and sticking them in the AppSource. I’m very much an outlier for not using them and advocating others not to use them. There are 6 great reasons why below!
Some of them are flashy, some of them are simple… but I haven’t found one yet that I can’t live without, and you can live without them as well.
Here’s why:
1. A Huge Loss of Control.
Hey, Power BI visuals aren’t the best for custom formatting at the best of times. Labels with text? Colored text in legends? Custom label placement so your charts don’t look like a toddler threw numbers at your chart and hoped for the best? These are all dreams in the chart visuals that come “stock” with Power BI.
External visuals? Even less control. I’ve lost count of the number of times I’ve found a cool external visual but didn’t use it because I couldn’t format it to make it easier for my report viewers to interpret the data. External visuals are often (not always, but often) designed how the designer thinks they should look. If they like the formatting, you’re going to get very few formatting options. Change the color of something? NOPE. Change a font size? NOPE. Add a label somewhere? NOPE.
2. Changes can be sudden and break things
Even worse than the loss of control when designing a visual is the loss of control of what happens with that visual in the future.
When Microsoft makes changes to their stock Power BI visuals (which happens slowly), it seems like they make sure that any changes are backwards-compatible.
You don’t always have that safety blanket with external visuals. If a developer decides to change some code so their visual works in a different way… all of a sudden your copy of it that you’ve been using breaks. Even worse, it breaks and you don’t notice it (because a visual doesn’t send you an email when it breaks) but your report users do… and just think you’ve fallen asleep at the wheel.
3. They are removed from AppSource
It doesn’t happen often, but external visuals sometimes get removed from AppSource, either by the developer or by Microsoft.
You have a copy of it on your report, and it won’t break (it’s your own local copy), but good luck trying to build a report with that visual again. You do NOT want to get dependent on an external visual. There
4. They can be expensive (for you and your users)
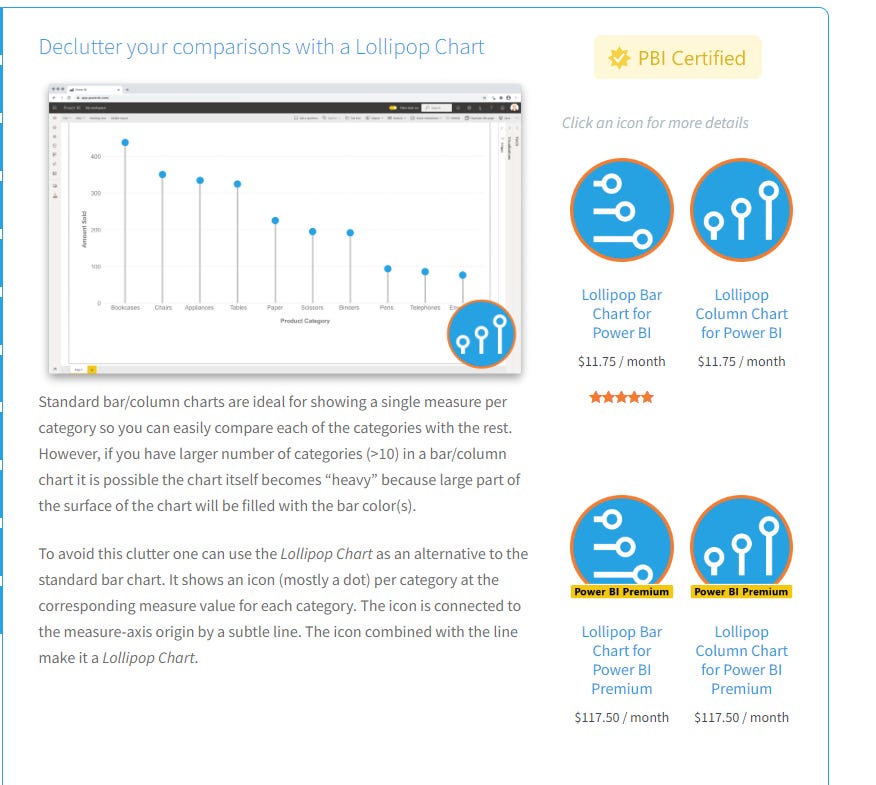
There are free and “premium” visuals on AppSource. It’s usually on a per-user per-month basis, so if you’re at a large organization and need to lots of people to see an external visual, open up your pockets. Wide.
Here’s an example for a Lollipop chart. Further down this post you’ll see that Lollipops are totally doable without an external visual.
If you are sharing your reports with external viewers, guess what? They ALSO have to PAY to see these visuals. Every month.
5. You can probably make them yourself.
External visuals, generally, can be made with the stock visuals of Power BI. There are a lot of stock default visuals that come with Power BI, and they have lots of options for customizing what type of chart you’re actually making.
A Line Chart can be WAY more than just a Line Chart. A Bar Chart doesn’t have to live it’s whole life as a Bar Chart. A Scatterplot has sooo many possibilities.
Dare to dream. It just takes a bit of creativity to bend Power BI to your will and make things yourself (and once you figure out the tricks, it’s so EASY).
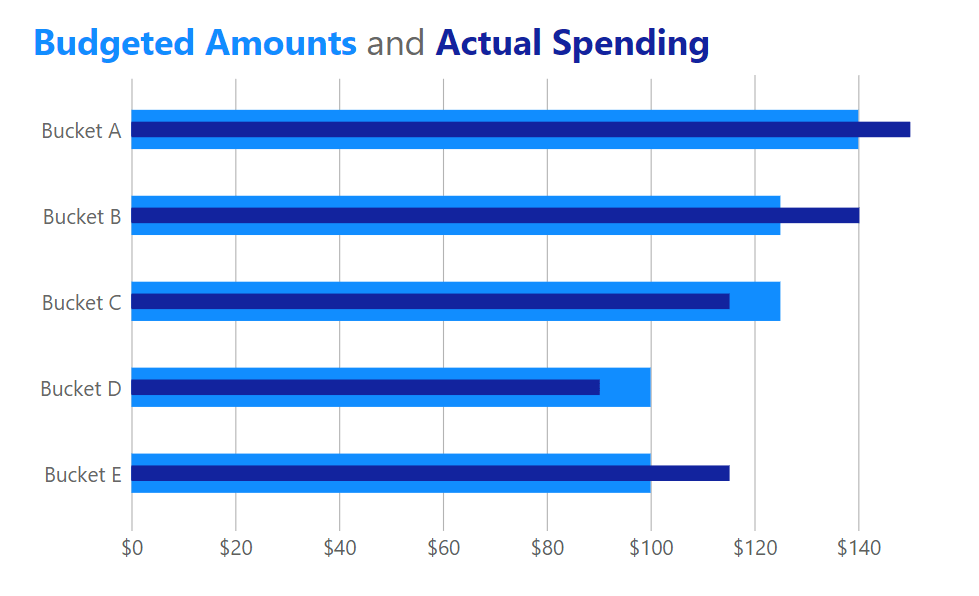
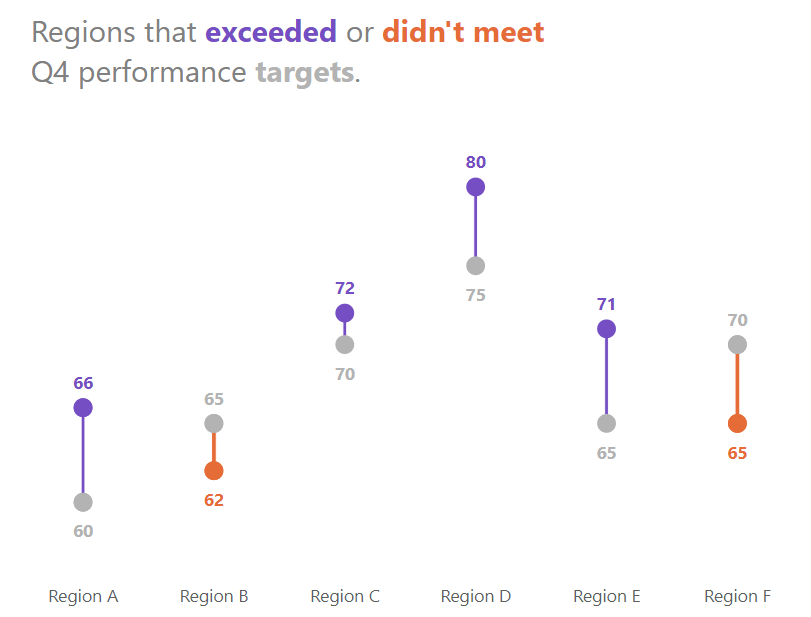
Here’s a few example of what I’ve made with stock visuals… and these are all visuals that a lot of Power BI designers use external visuals for, because it seems like they aren’t possible without external visuals…
Overlapping Bars!
Sweet sweet vertical Lollipops!
Strong powerful Dumbbell Dot Plots!
Buzzy Beeswarms!
Timely Calendars!
(see this in action over on my website)
Filled Intersects!
Actually, this one I haven’t seen ANYWHERE, not even in an External visual…
6. You and your users probably don’t need external visuals anyway!
External visuals are usually used when the stock Power BI visuals “don’t do enough”. Designers use them to make overly-complicated visuals when the stock issues can’t.
These are the visuals that usually go viral on social media… they’re fancy, complicated, have lots of data in them… but they’re not very useful or easy to understand. They are Hot Messes.
Yes, I wrote about Hot Messes a few months ago.
Don’t give your dashboard users a Hot Mess. Give them nice and easy (and innovative) visuals that can help them get the info they need, fast.
Yeah, the kayaking was still amazing. Deep Cove, BC… sunset. How can it not be? :)
Can I help you out with your Power BI report design? Ask me! This is what I do (and teach people and organizations to do!)
Get in touch with me. I love to teach people new things.
You can reply to this email (or comment below if you’re not reading this in your email.)
Email me at joe@traversdata.com
Msg me on twitter @josephtravers
Connect with me on LinkedIn @traversdata
If you enjoyed this post and want to share it with someone, share away! Sharing is caring.
If someone sent you this post or saw it on twitter or LinkedIn and you want to subscribe so you don’t miss a future post, you can do that below:


